By Kevin Horan
Director, Fixed Income Indices
S&P Dow Jones Indices

Photo courtesy of AFP/Mladen Antonov
Unlike Treasuries and investment grade corporates, the high yield market as measured by the S&P U.S. Issued High Yield Corporate Bond Index touch a low point for yield earlier in the month at a 5.87% on October 6th. This market was in the process of selling off and had a yield of 6.51% on October 15th, up 65 basis points from the 6th and 38-basis point higher than the 6.13% start to the month. High yield’s reaction posts October 15th was “risk on” as yields since then moved 60 basis points lower to a current level of 5.91%. Month-to-date the total return of the index is 1.09% and for the year has returned 4.66%.
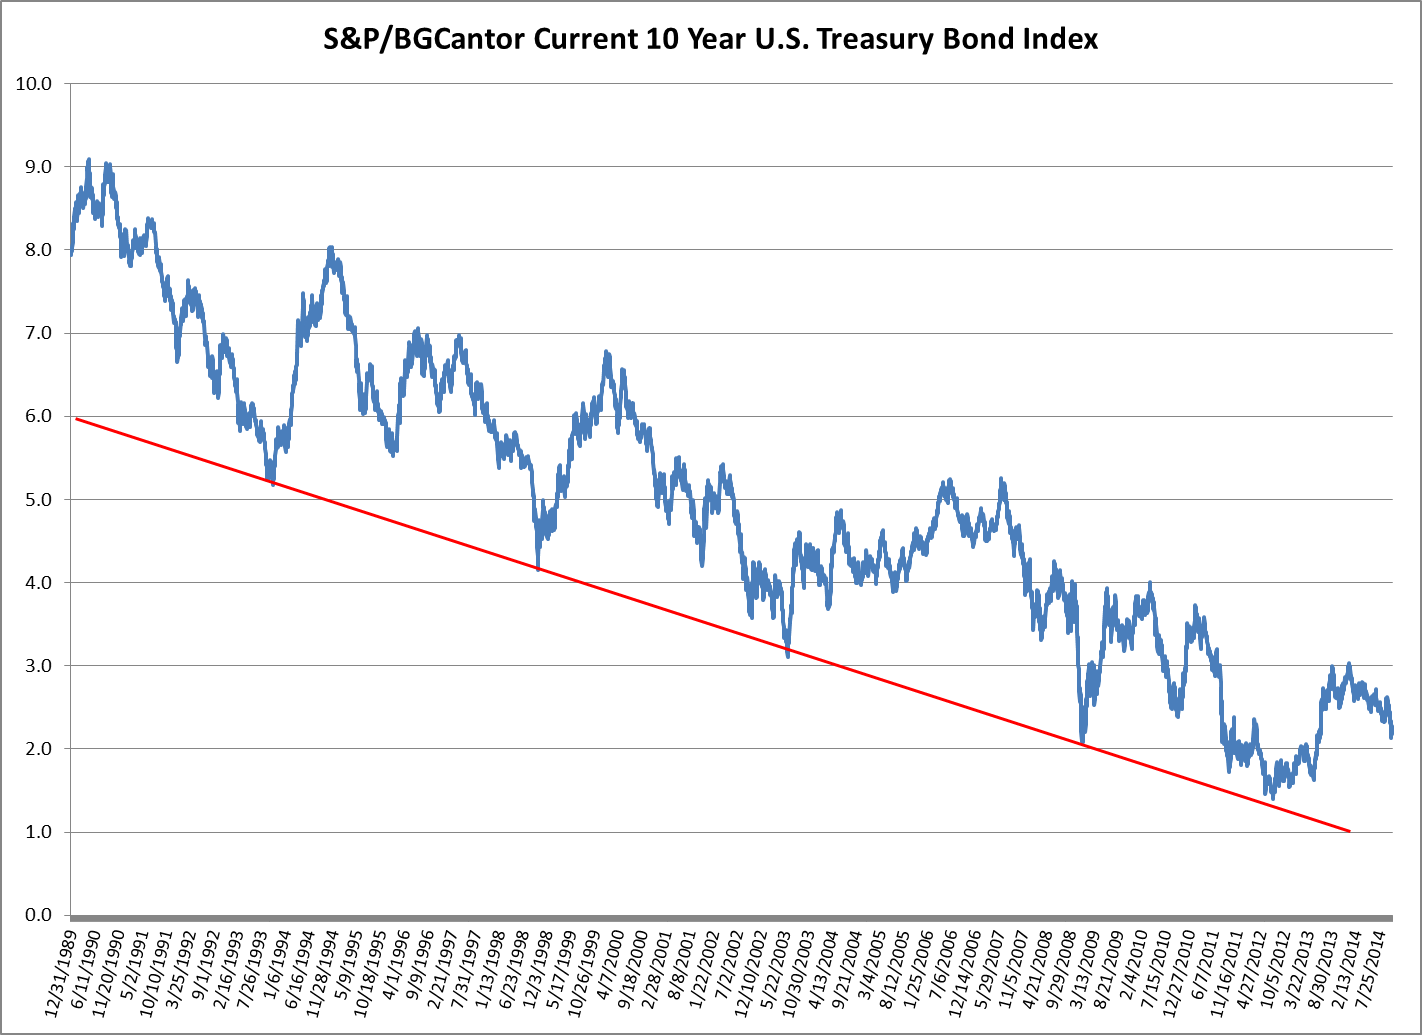
After having dropped to a low of 2.13% on October 15th, the yield of the U.S. 10-year as measured by the S&P/BGCantor Current 10 Year U.S. Treasury Bond Index has risen by 14 basis points to its current 2.28%. Year-to-date yields are 75 basis points lower than the start of the year. Though 2.13% is the lowest point for 2014, it is not the lowest for the index which was 1.39% back on July 25th of 2012. If the trend is your friend, then expect lower yields in the near future. If however you think next week’s FOMC meeting will be the event that turns the tides then now would be the inversion point.
Like Treasuries, the yield of the S&P U.S. Issued Investment Grade Corporate Bond Index (2.77%) is 14-basis point higher than the 15th of the month. At mid-month, the year-to-date total return of investment grade corporates was at 8.02% but has dropped down to its current 7.03% with the slight move up in yield. The index is still comparable in return to recent years past, which have ended the year up above 8% except for 2013 in which the index spend most of the year in negative territory.
Source: S&P Dow Jones Indices, 10/23/2014
© S&P Dow Jones Indices LLC 2013. Indexology® is a trademark of S&P Dow Jones Indices LLC (SPDJI). S&P® is a trademark of Standard & Poor’s Financial Services LLC and Dow Jones® is a trademark of Dow Jones Trademark Holdings LLC, and those marks have been licensed to SPDJI.
This material is reproduced with the prior written consent of SPDJI. For more information on SPDJI, visit http://www.spdji.com


Discussion
No comments yet.