By Dan Popescu, GoldBroker.com
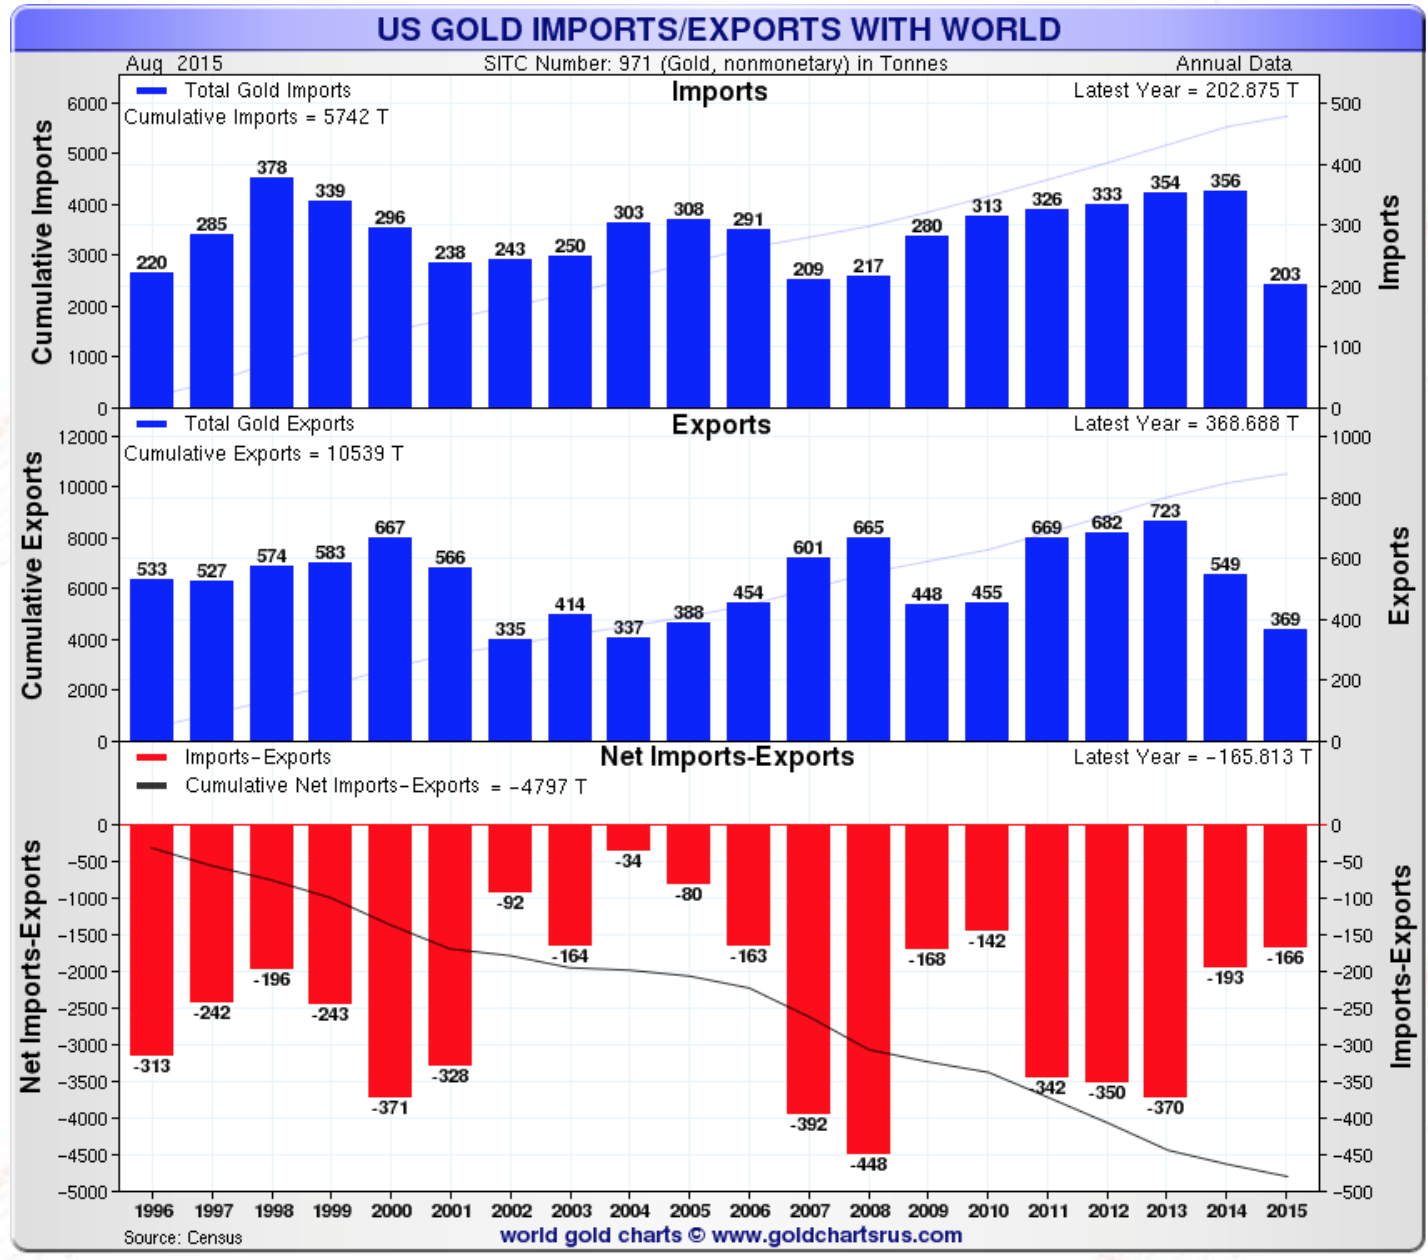
Thanks to a set of excellent charts on gold imports vs exports by Nick Laird (www.sharelynx.com), I would like to give you a brief outlook of where is gold going. We heard for some time that gold is moving to the Far East but is it really only moving there? Well if we start with the US, it certainly is going out. In the first chart, we can observe that at least since 1996 gold has been leaving the US without exception. Even at the top of the gold market when the price crossed briefly $1,900 gold exports exceeded gold imports for the US. However, according to Nick Laird, for the US if you add up their gold mine production it puts them in a net neutral position. So their imports plus production equals their exports; this over the last 18 years.
Chart #1: US Gold Imports minus Exports
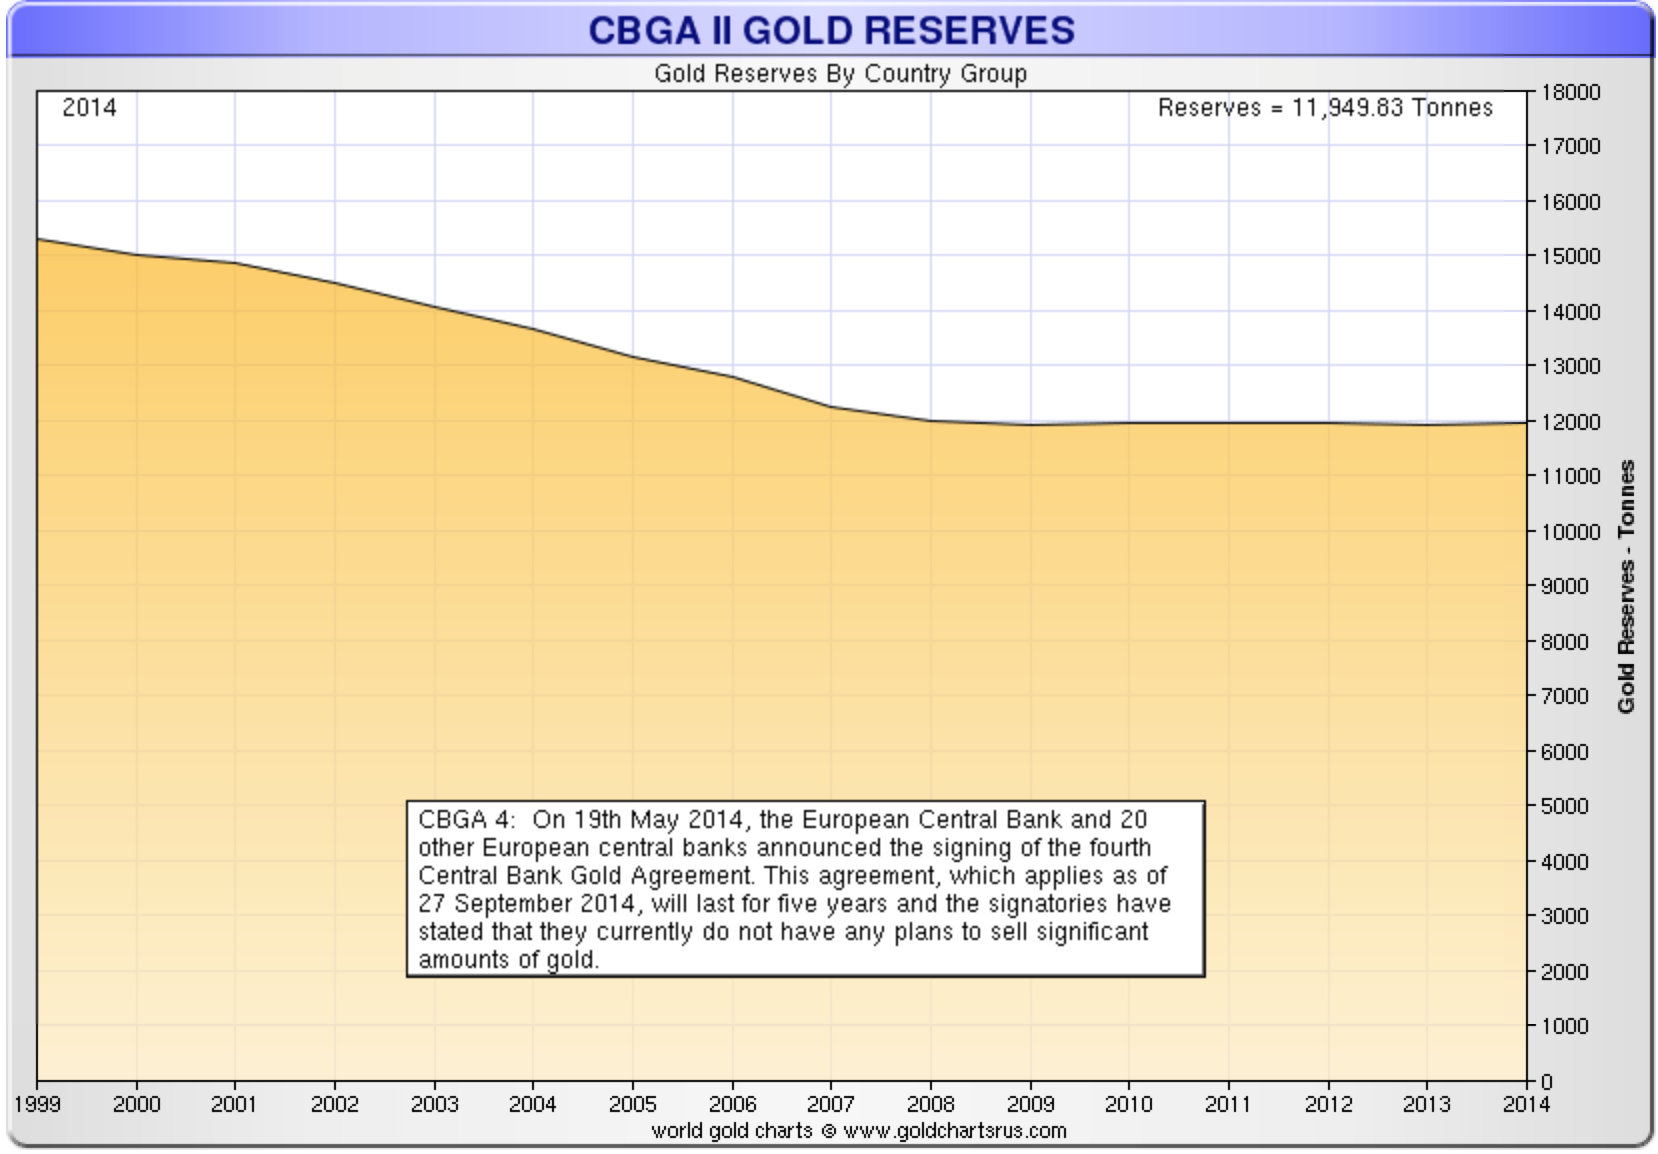
Is this the same case for Europe? Contrary to what you might think gold is moving from West to East but some is not going all the way to India and China but rather stops in Europe. I have always made a distinction between North America (US and Canada) and Europe. In the second chart below, we see that European central banks have stopped selling gold in 2008 which corresponds with the financial crisis that almost brought down the international financial system. What is interesting is that they have not restarted buying although we have heard during the last year several European central banks talking up gold and in the last quarter, the central bank of Italy published a very positive study on the value of gold as a reserve asset. Last year Mario Draghi, president of the European Central Bank, at a question asked about gold, without hesitation, replied “For central banks this [gold] is a reserve of safety, it’s viewed by the country as such. In the case of non-dollar countries it gives you a value-protection against fluctuations against the dollar.” Can we expect a change in attitude by the ECB towards gold and the beginning of buying? I wouldn’t be surprised.
Chart #2: European central bank agreement on gold selling
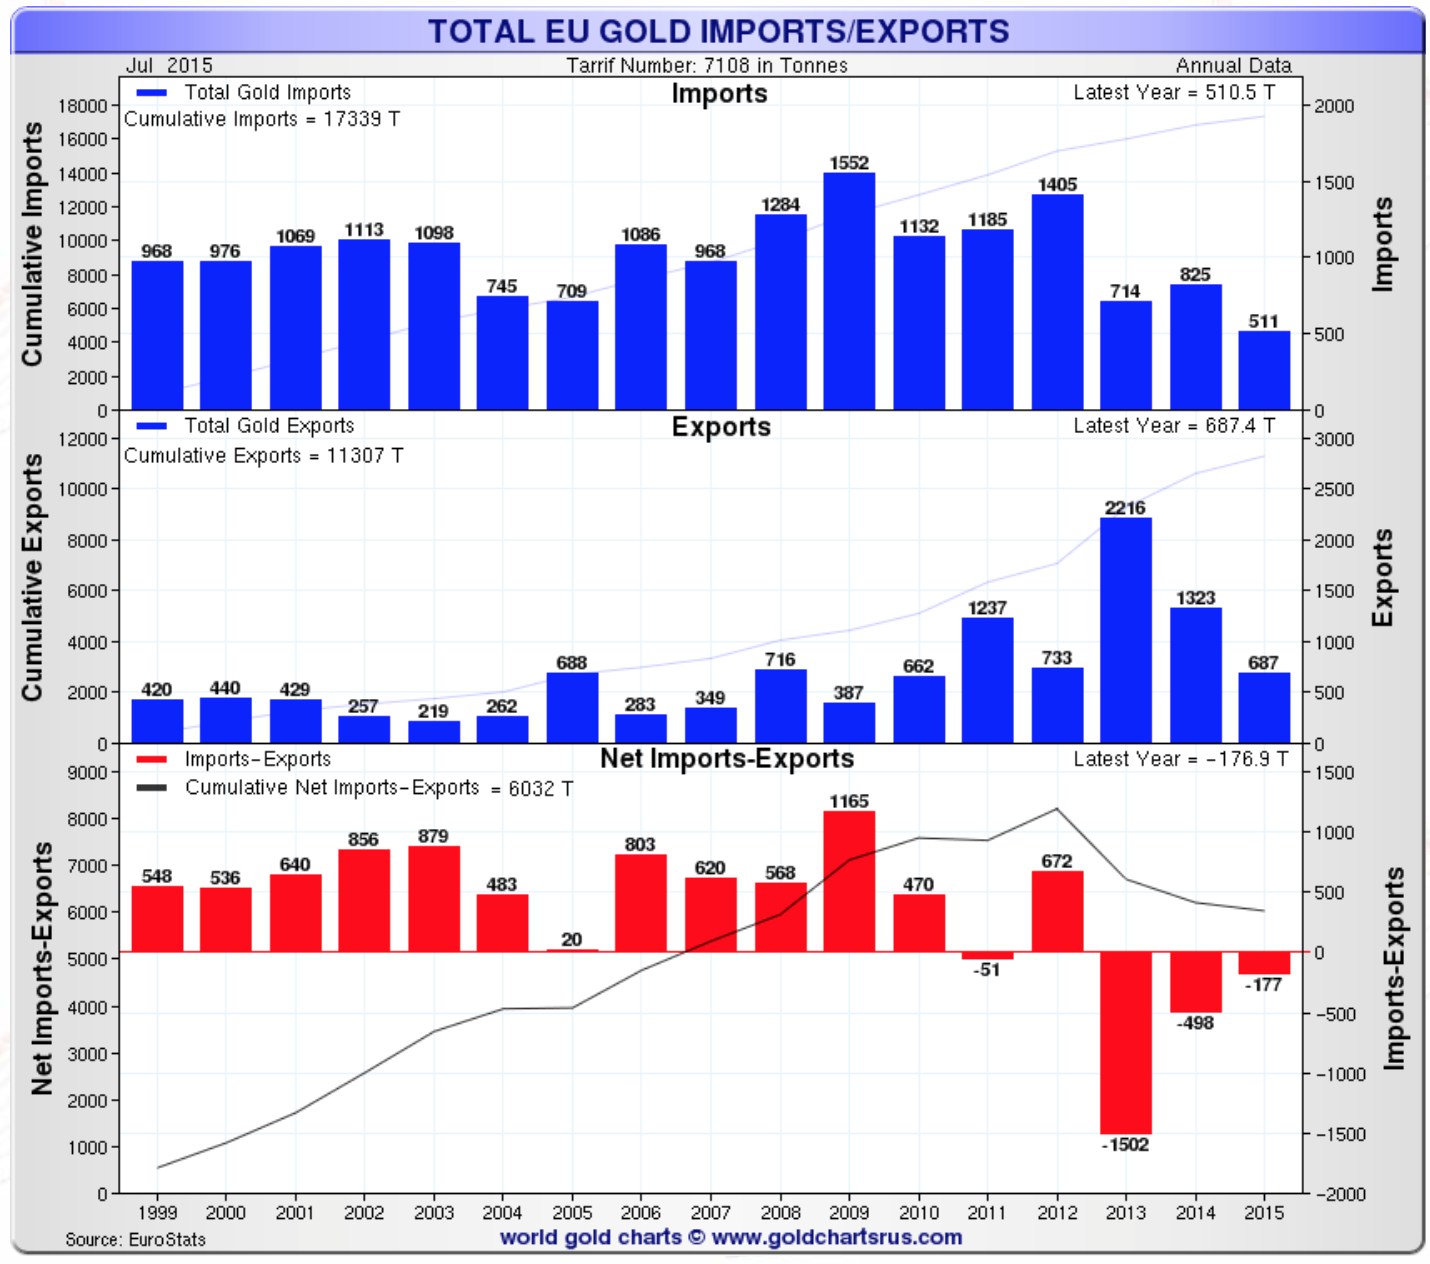
The next chart shows clearly that Europe has been importing more gold than it exported since the low in the gold price in 1999. The lowest dollar gold price was the afternoon London fix on July 20, 1999 when gold was fixed at $252.80. Exports started to exceed imports only in 2013 and they have been decreasing since then. I expect imports to be higher than exports again in 1016 in Europe.
Chart #3: Total European Union Gold Imports minus Exports
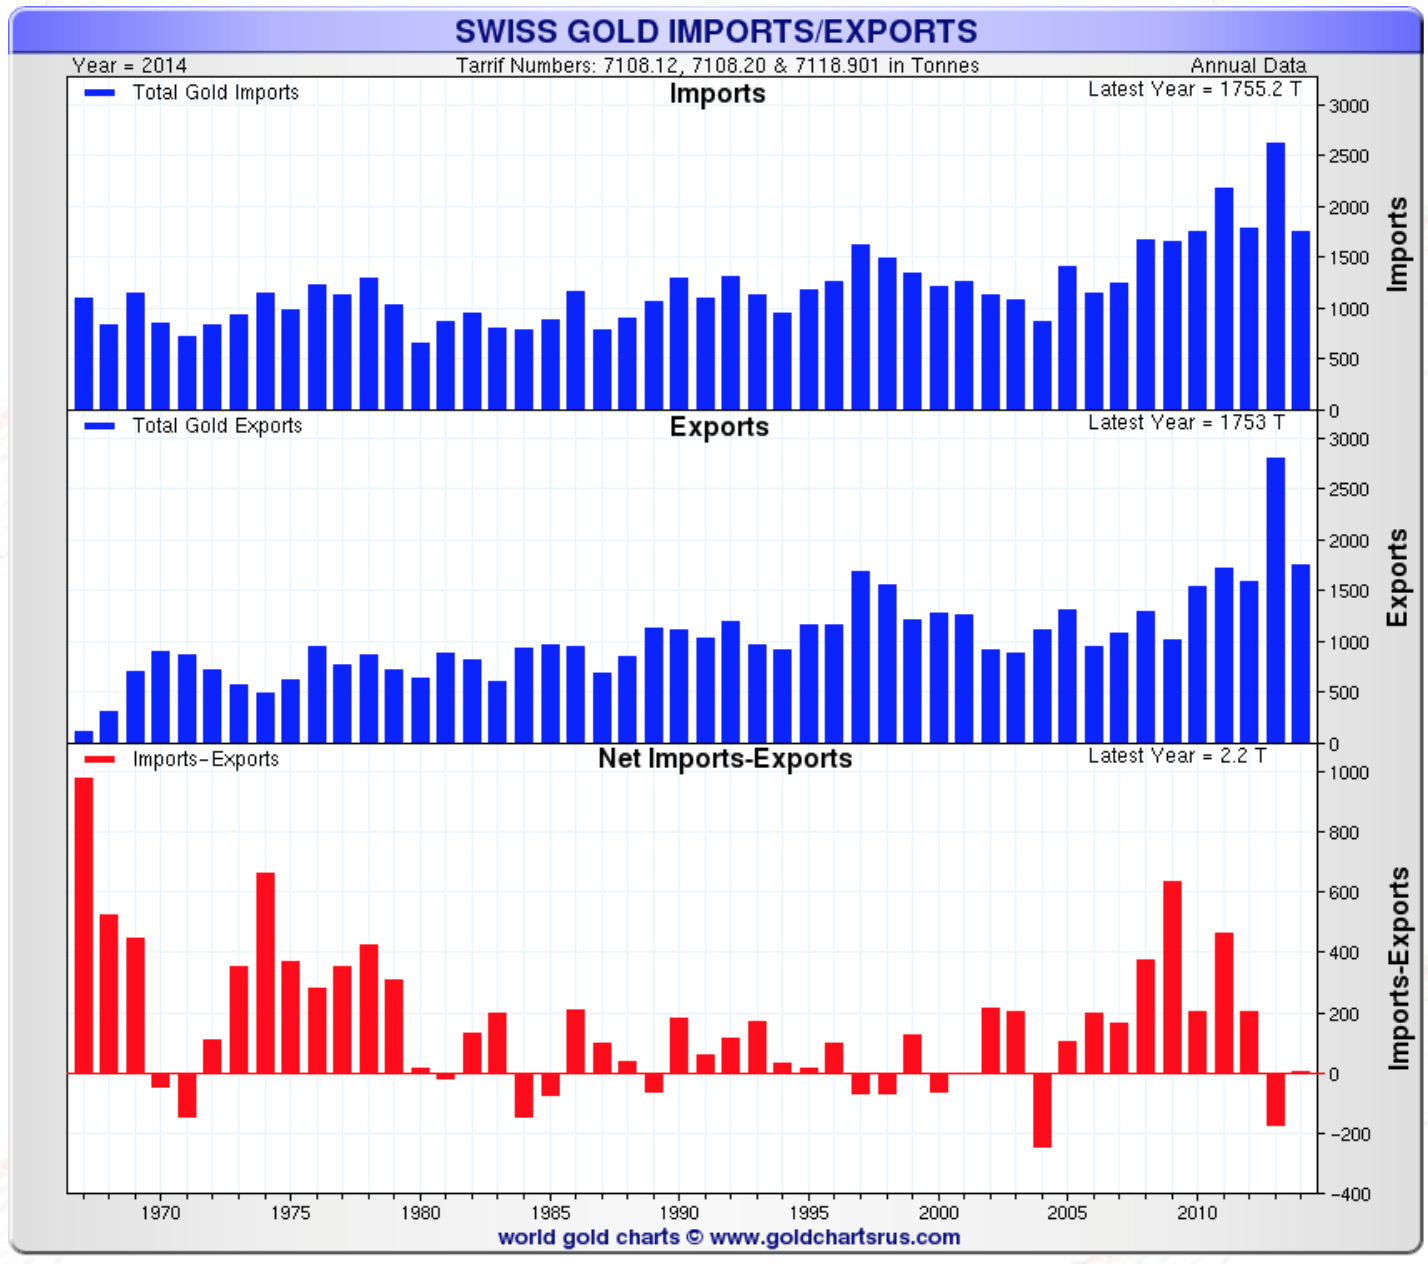
Two interesting and particular cases in Europe are Switzerland and Romania. In chart #4 we can see that since the 60s there has been more gold flowing into Switzerland than it has been exported. However even more interesting is the high level of imports vs exports in the 70s and since 2008. Both periods correspond to major international financial and monetary crisis. Switzerland is reputable as an excellent place to store wealth and in particular gold. Switzerland is known for a stable political, economic and social environment. This explains in large part the pressure on the Swiss National Bank to stop the flow of funds into Switzerland. Gilles Labarthe, Swiss journalist and ethnologist, said “Switzerland is for gold what Bordeaux is to wine.” (“Switzerland’s Role in the Gold Market”). Switzerland, according to Nick Laird, has net 7,930 tonnes of gold of which 1,040 tonnes as official reserves. My speculation is that there could be a lot more unaccounted gold hidden under the Alps.
Chart #4: Swiss Gold Imports minus Exports
To the other extreme in Europe, let me mention the case of Romania. Romania with a GDP of only $199,950 mil. is not as rich as Switzerland who has a GDP of $703,852 mil. However, Romania has a very large stock of gold in its official reserves (103.7 tonnes). According to Romania-insider.com, “Romania is one of the countries with the highest gold reserves per inhabitant (5.5 grams of gold per inhabitant), and the local currency is 60% to 70% offset by gold, said the Romanian Central Bank Governor Mugur Isarescu.” During a recent trip to Romania, I was also surprised by a marketing campaign at the foreign exchange desk of a major bank to sell gold bars to the public.
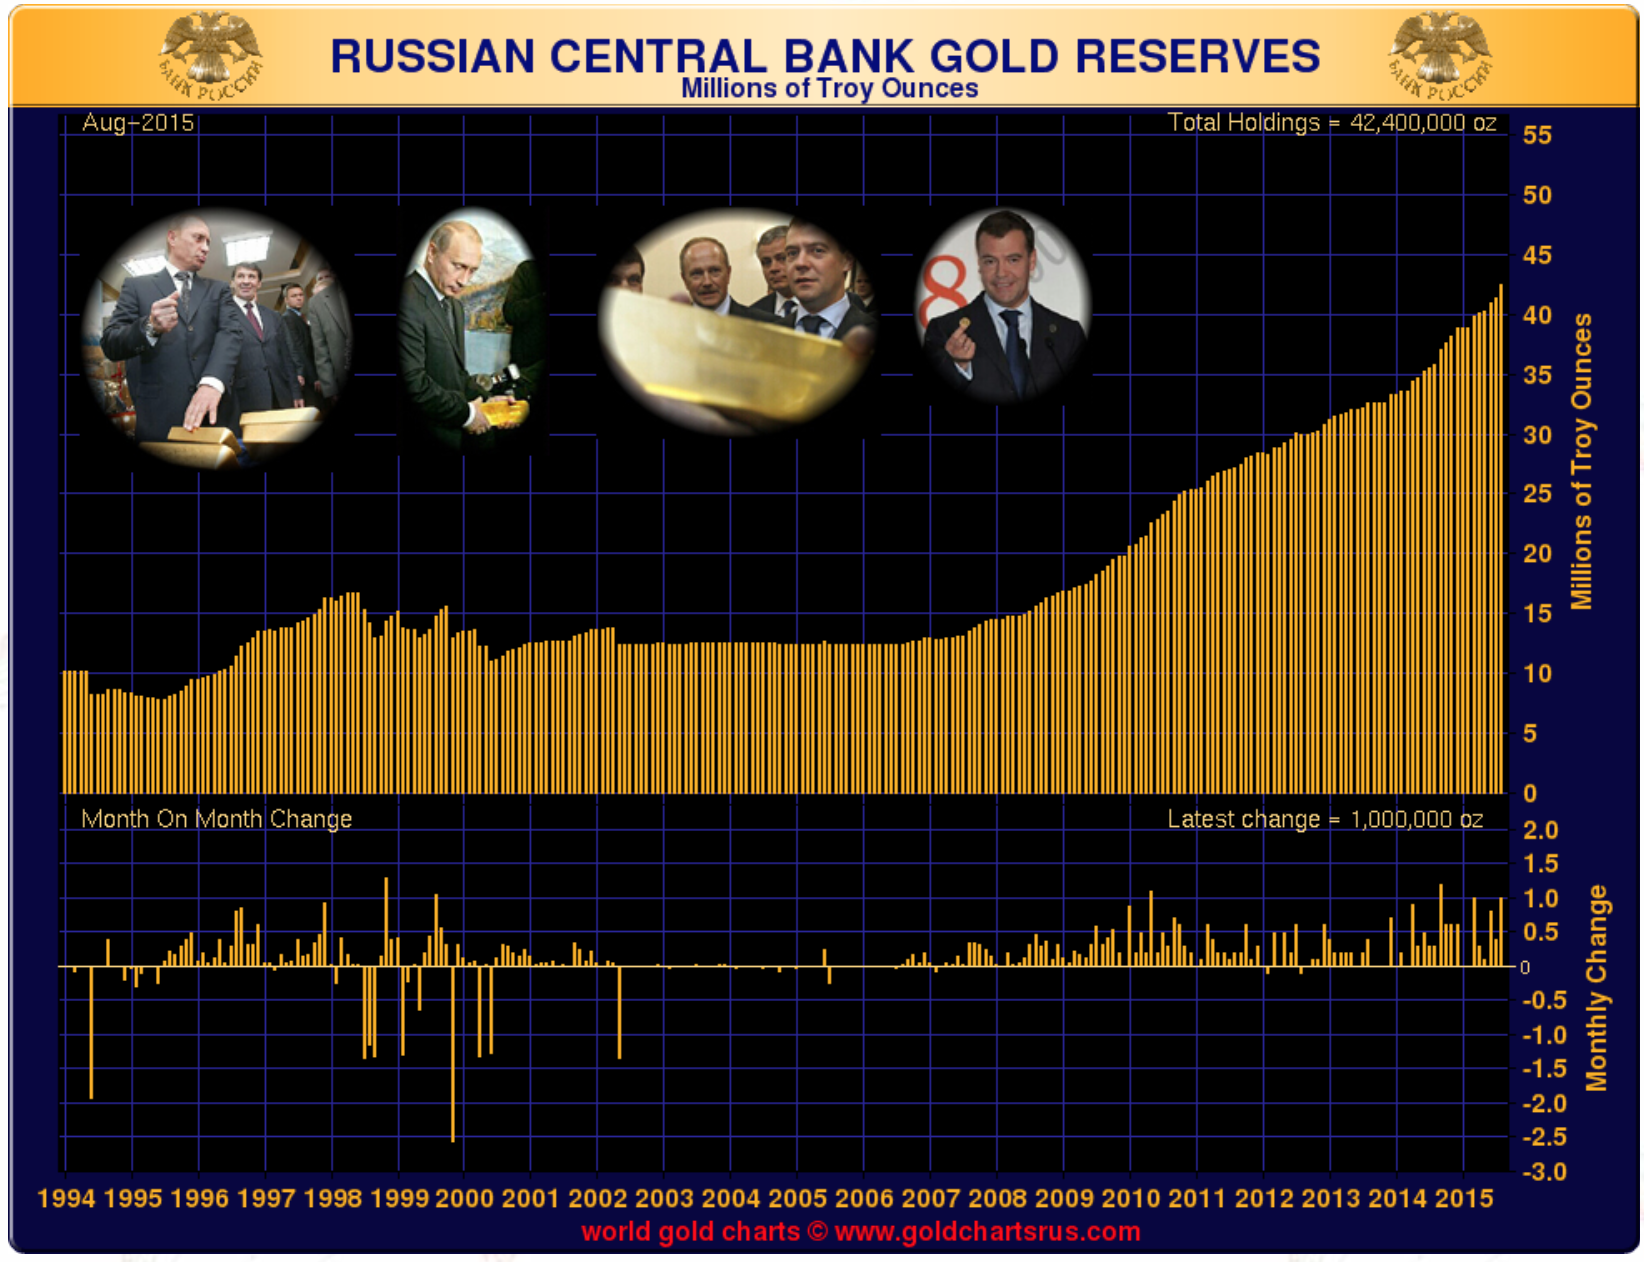
Russia is a large producer of gold so I expect some gold to be exported but looking at chart #5 we can see clearly the massive gold buying by the central bank of Russia since the 2008 financial crisis and an acceleration since the beginning of the new cold war and the sanctions imposed by the US and the EU. Since 2008, Russia has increased by four its official gold reserves. Russia buys most of its official gold internally from Russian gold miners.
Chart #5: Russian Central Bank Gold Buying
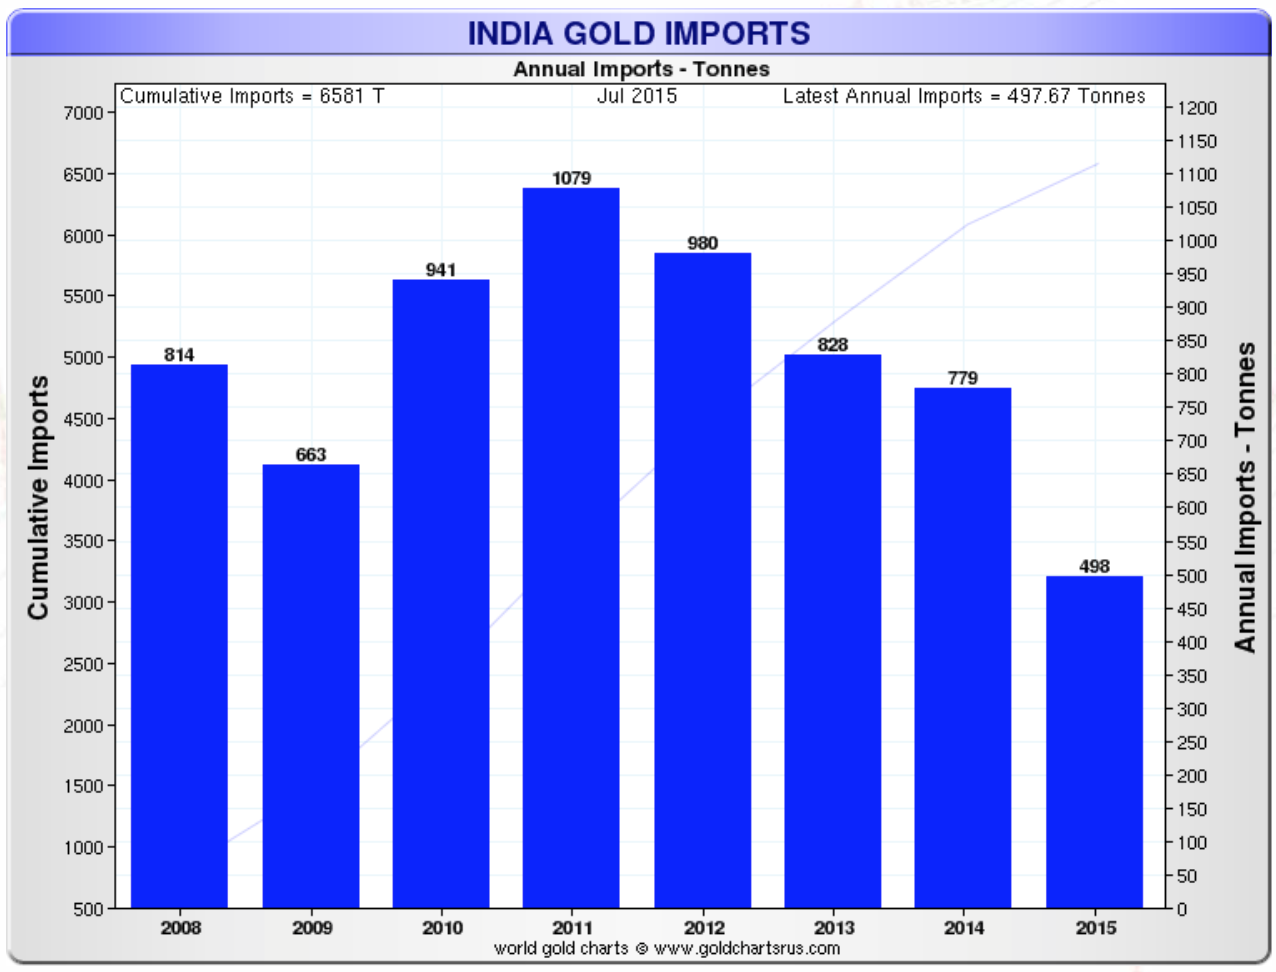
If we move east to Asia, we can see the large demand of gold by both India and China. The import restrictions imposed by the government of India has not stopped the flow of gold into India. Some estimates indicate approximately 18,000 tonnes of gold is held in India with most of it in private hands vs 557.7 tonnes by the Federal Reserve Bank of India. Indian gold in private hands represent about 10% of the world’s entire aboveground gold stocks. Other estimates go even farther than that to approximately 30,000 tonnes. A French visitor to India, Francois Bernier, enviously wrote 360 years ago how “It should not escape notice that gold and silver, after circulating in every other quarter of the globe, come at length to be absorbed in Hindustan.” Roman historian, Pliny, lamented some 1800 years ago, how India, the sink of precious metals, was draining Rome of gold, an appellation that resonates even today.
Chart #6: India Gold Imports
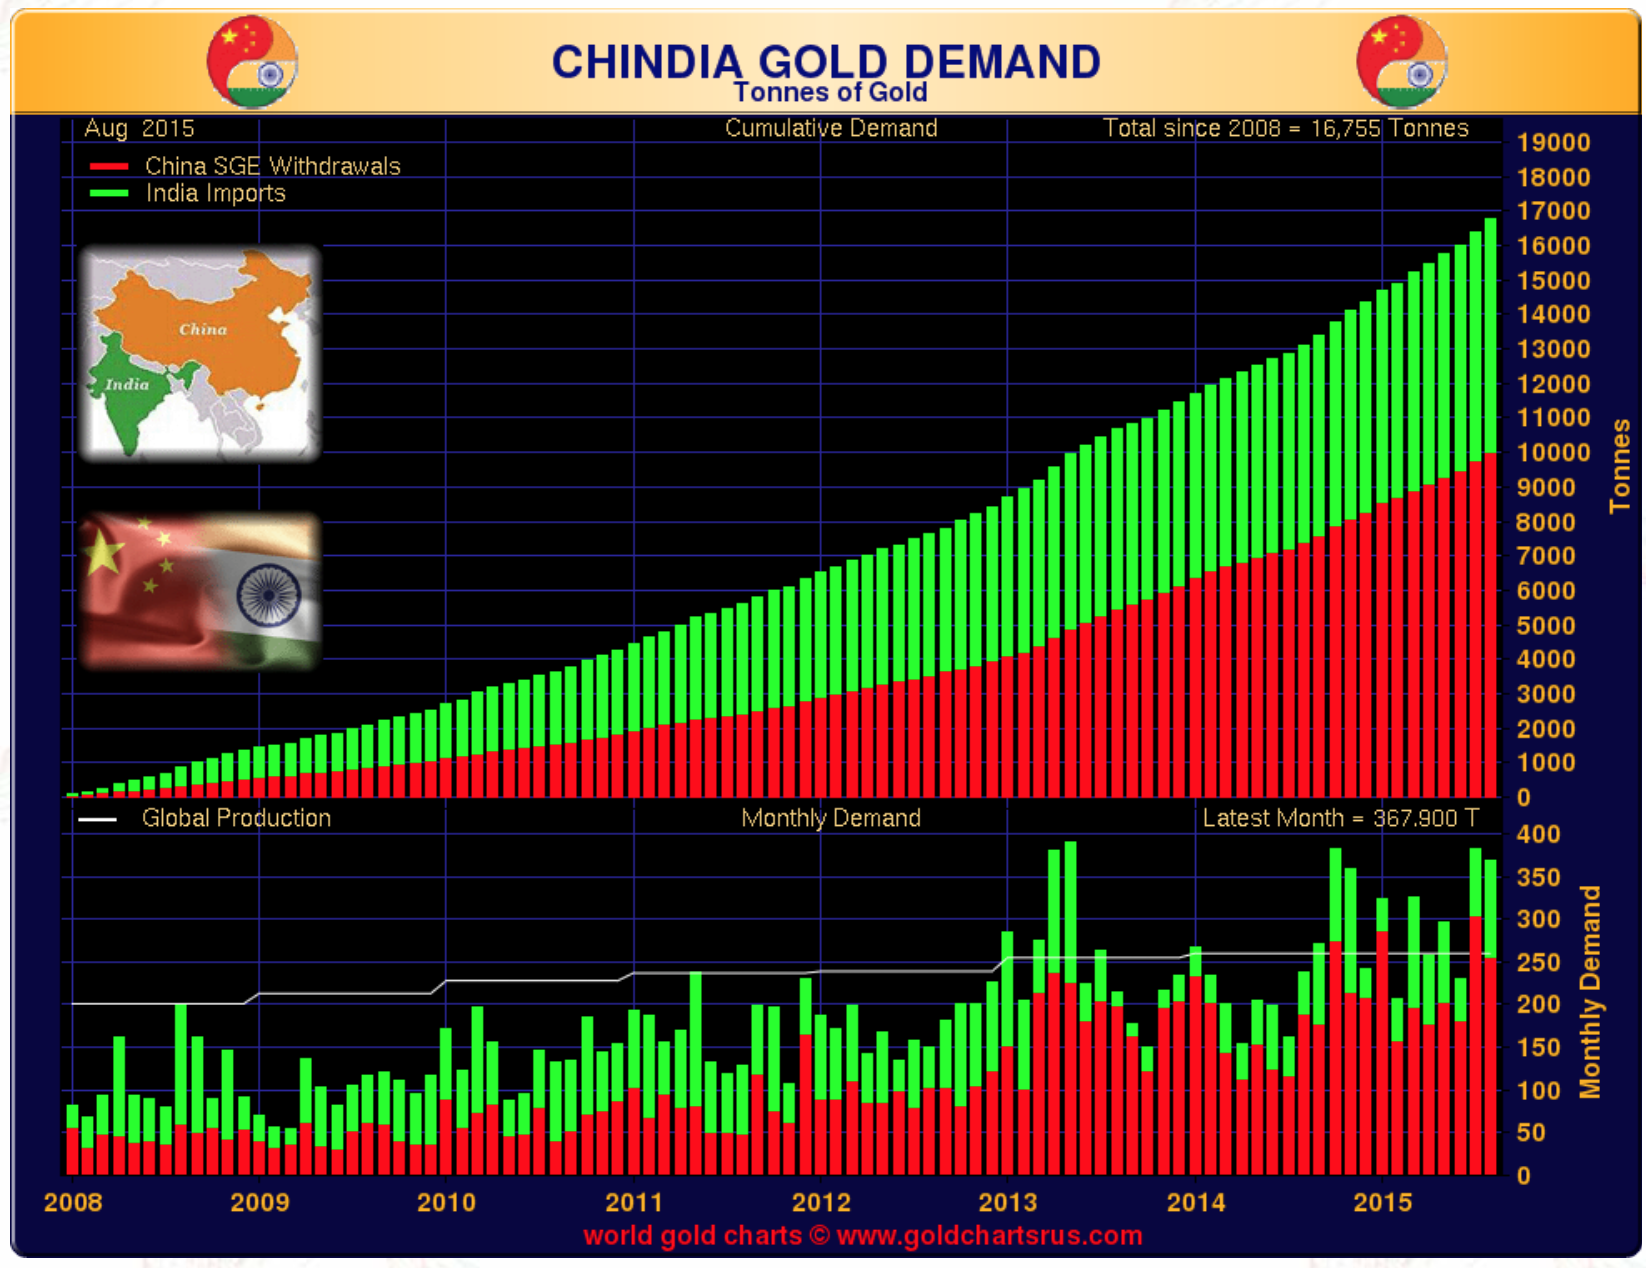
Both India and China are net importers of gold. The Reserve Bank of India announced in 2009, it has increased its official gold reserves of 357 tonnes by 200 tonnes (56%), while China’s total gold demand since 2008 has gone from zero to approximately 10,000 tonnes.
Chart #7: China and India Gold Demand
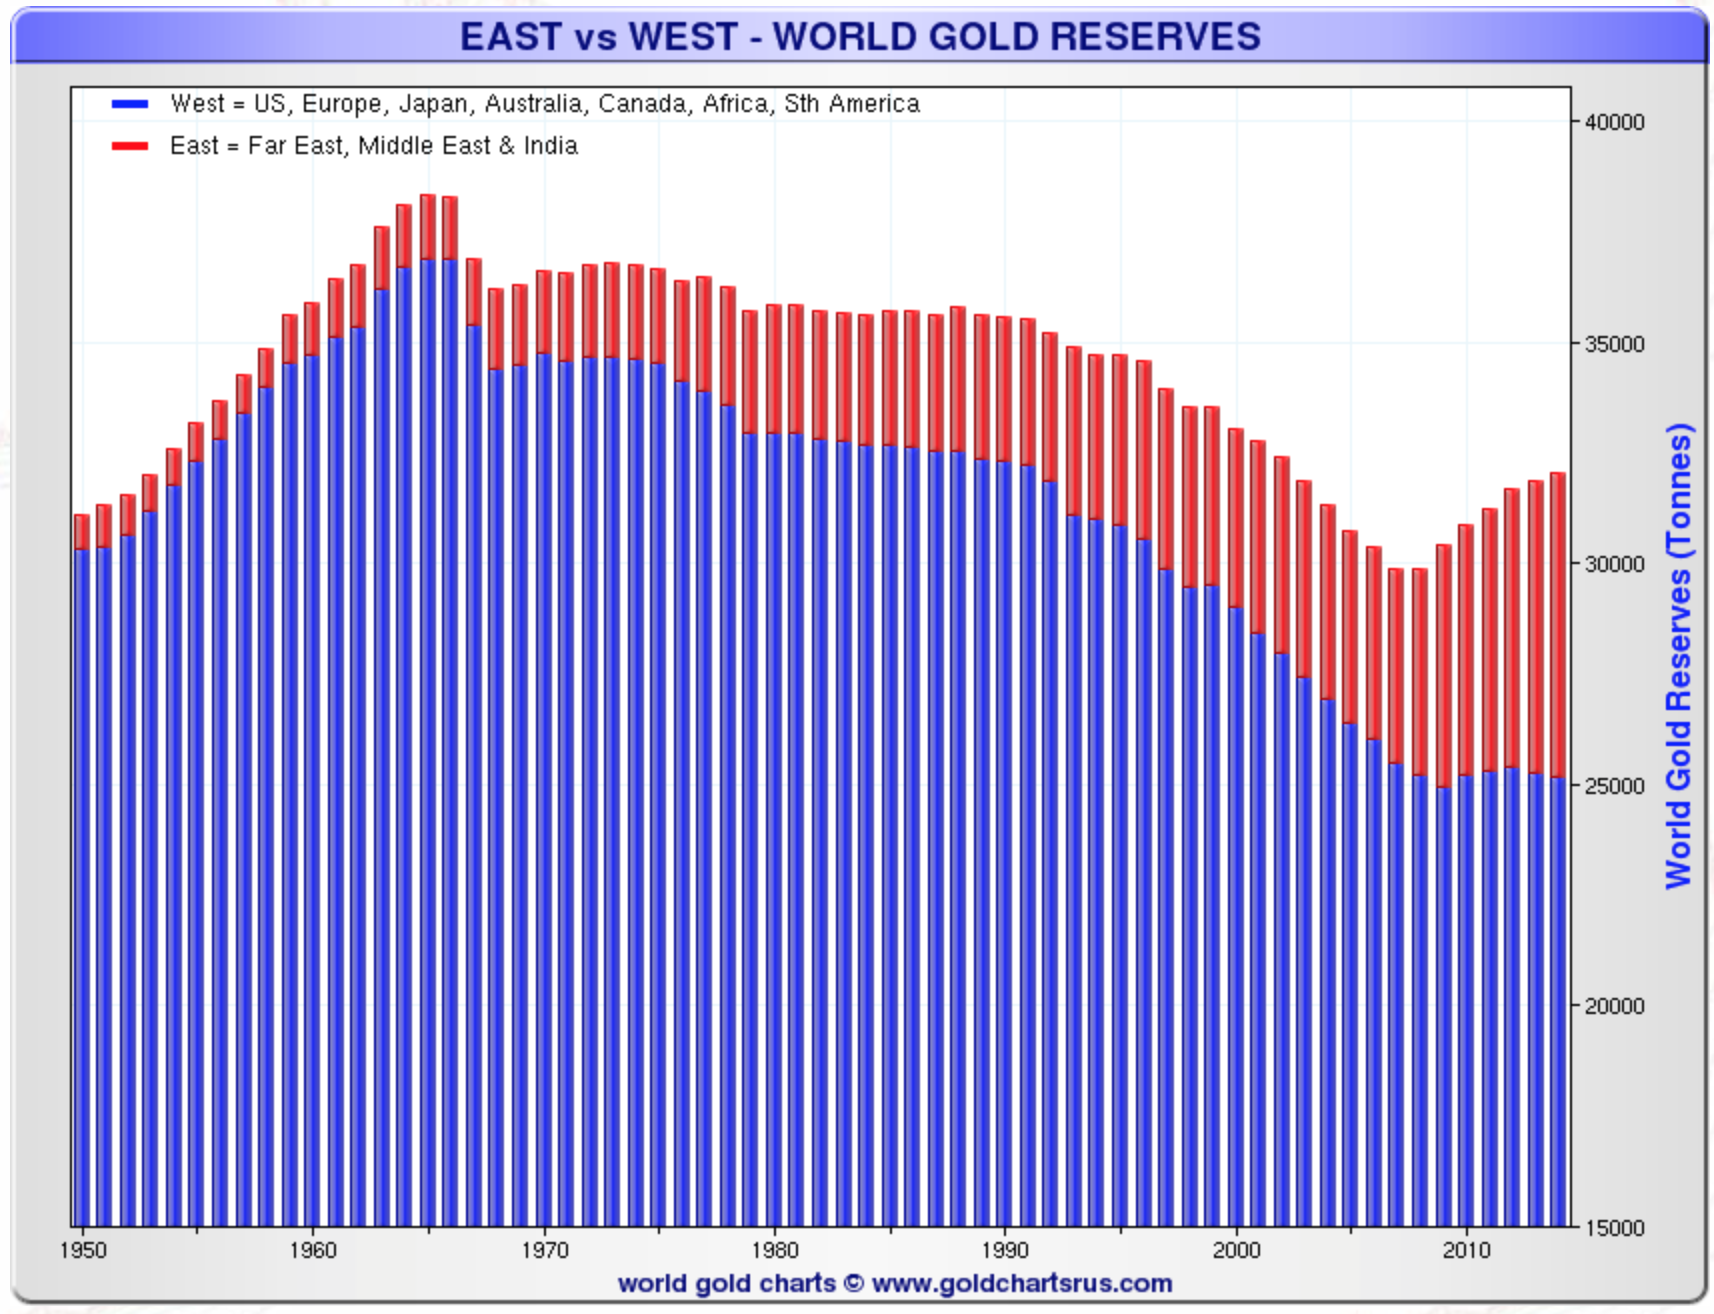
So as you can see from these charts gold is certainly flowing from West to East and mostly transiting through Switzerland but some stops into Europe. I have not mentioned Australia, which I speculate being a major gold mining country with Canada and South Africa, are exporting more than they import and mostly to Asia.
Two other areas that have a strong affinity with gold is North Africa and the Middle East but for which I don’t have much information. Saudi Arabia, one of the richest countries in the Middle East, is not making public its official gold reserves on a regular basis. Like China in the past it announced in 2008 it doubled its gold reserves. We could get a similar announcement soon. I would not be surprised by an announcement that they have more than 500 tonnes of gold reserves. Jordan, a very small country in the Middle East and not an oil producer, has discreetly almost tripled (2.7 times) its official gold reserves since 2008.
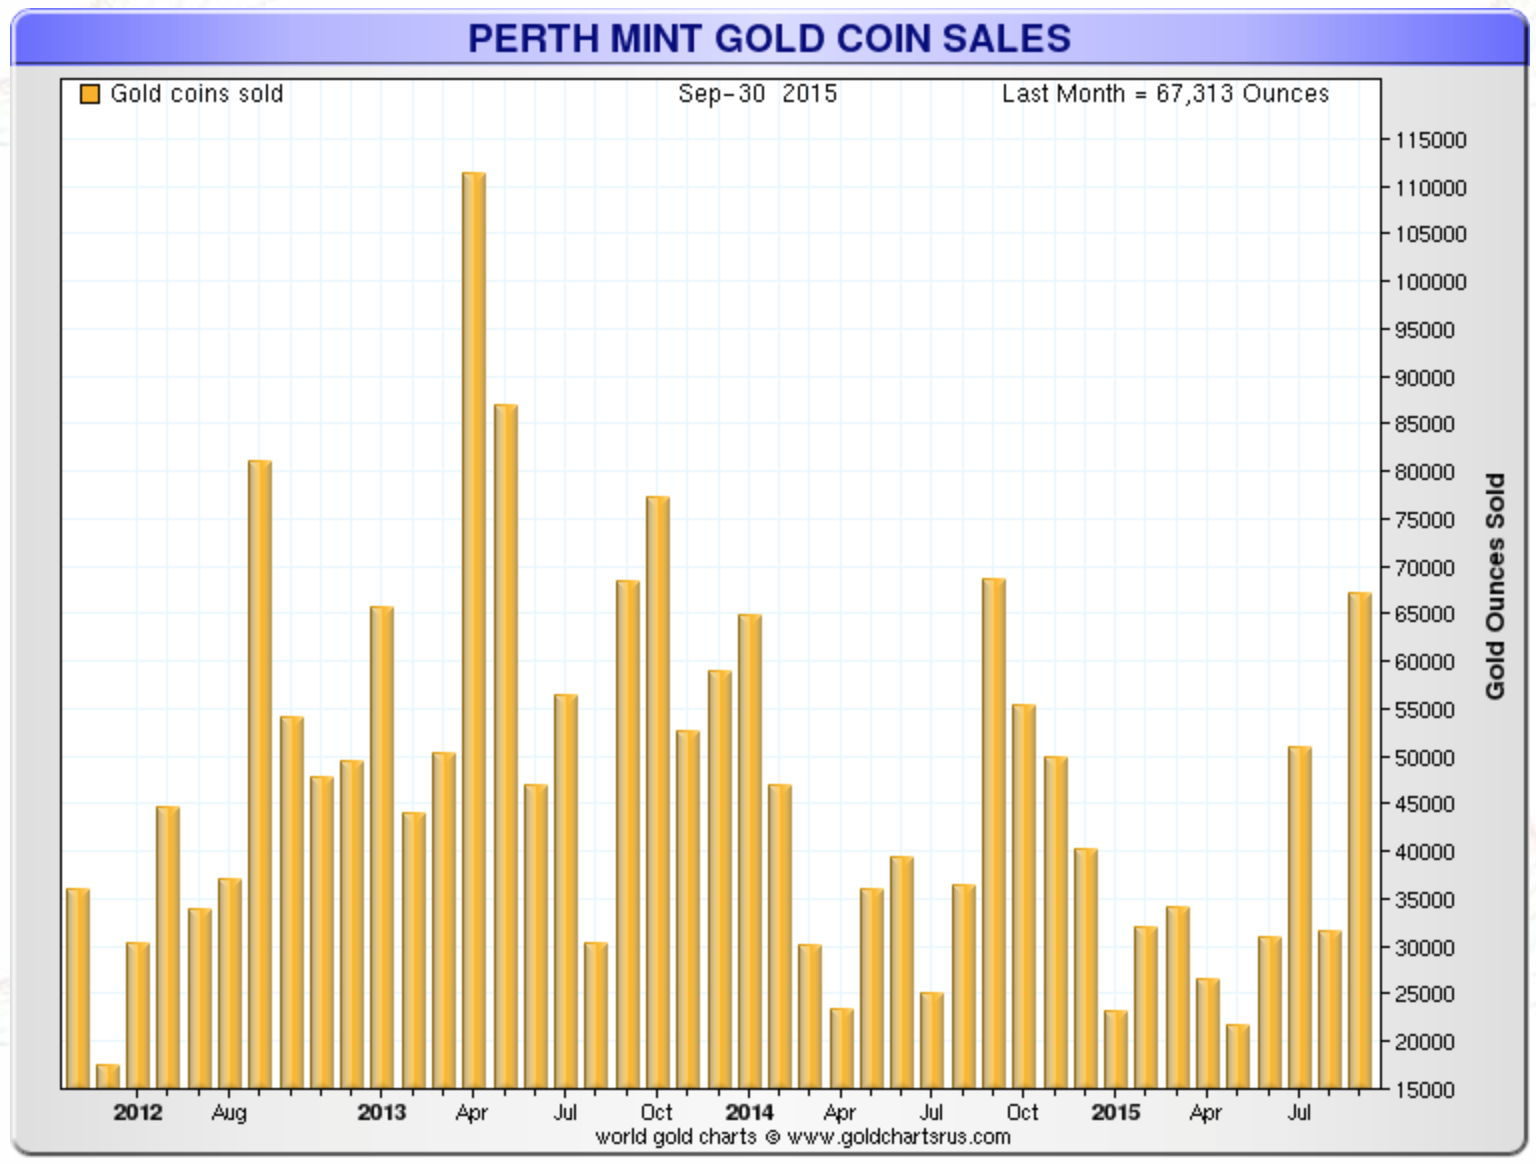
Recent data (chart #9 and 10) has also showed accumulation of gold by Australian, Canadian and American individuals. The demand for gold coins in these countries has been up which are mostly bought by small investors. However, Nick Laird was telling me that Bron Suchecki, Perth Mint, an excellent gold analyst from Australia, told him that 90% of what Perth Mint sells in Australia goes overseas; so Australian’s like North Americans are not large holders of bullion as a society.
Chart 8: US Gold Coin Sales
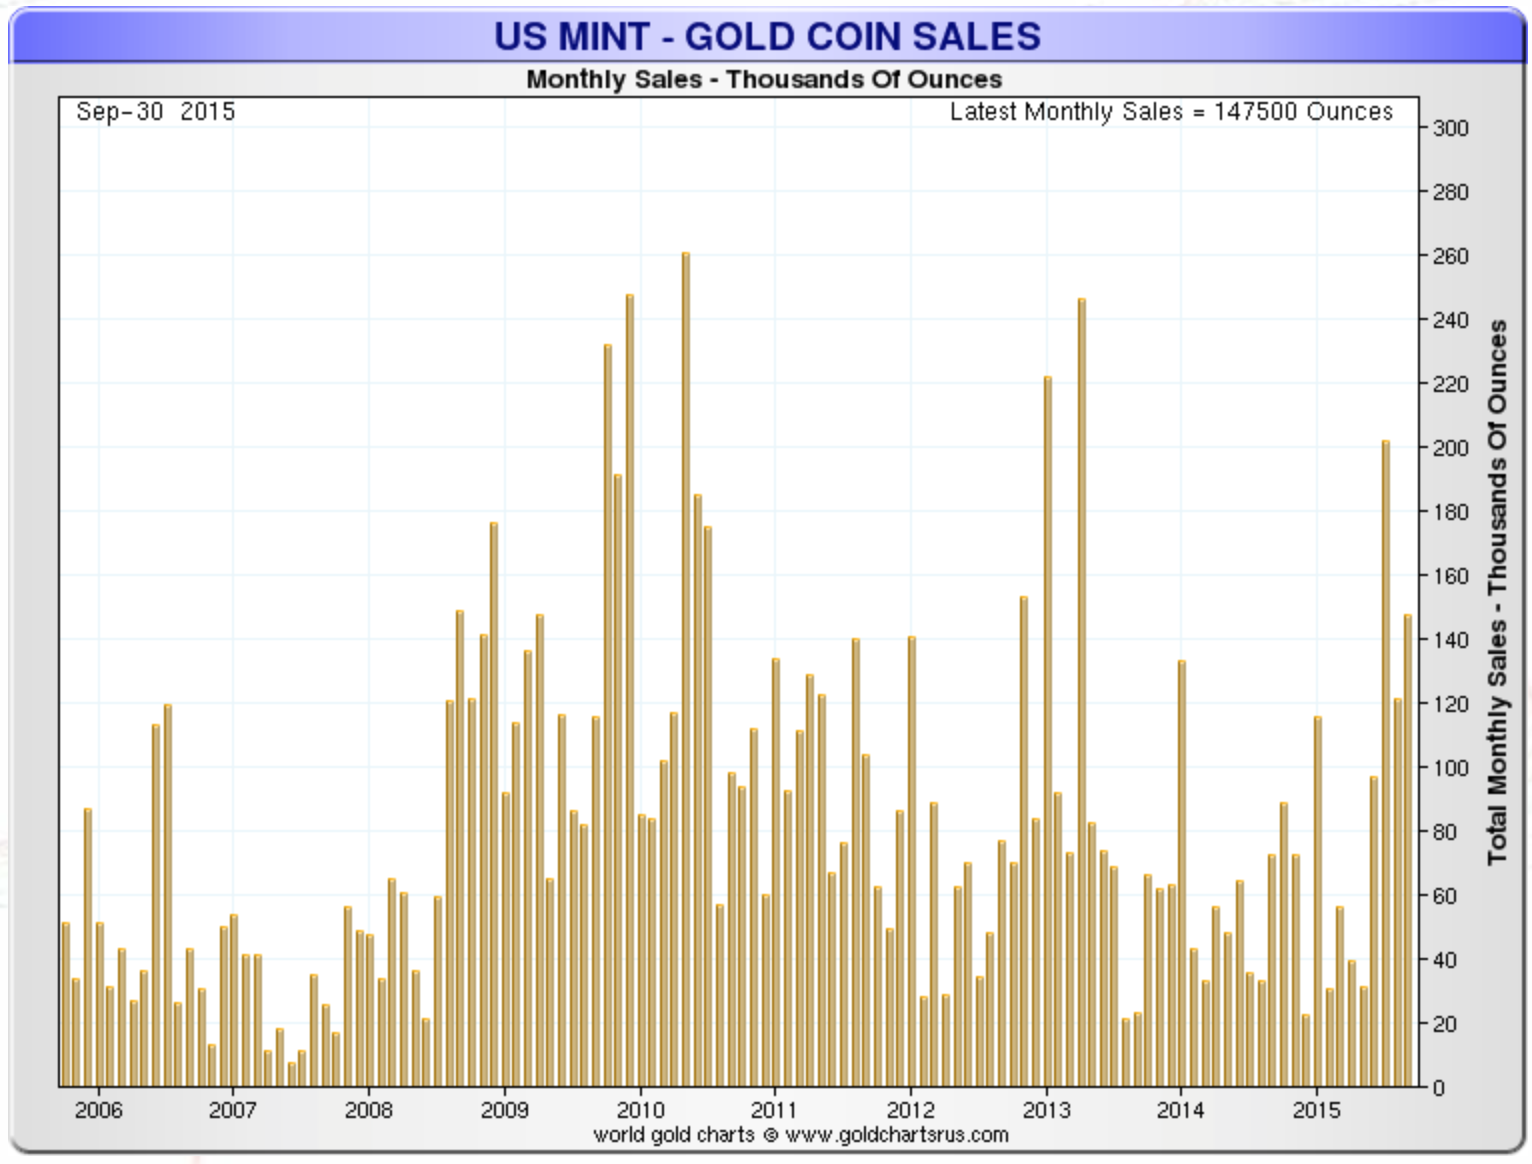
Chart 9: Australia Gold Coin Sales
As you can see gold is being accumulated not only in the East (China and India) but also in Europe, Middle East and North Africa. The major selling seems to be in the US and mostly in the paper gold market, which still has control of price at least for now.
Gold is an opaque market but my research and anecdotal evidence shows me that there is a lot of accumulation of gold going on that takes gold of the market for a long time. This is not short-term buying. Based on recent statements, as I already stated above, coming out from European central bankers, I would not be surprise to hear that Europe will soon start buying gold for its official reserves.
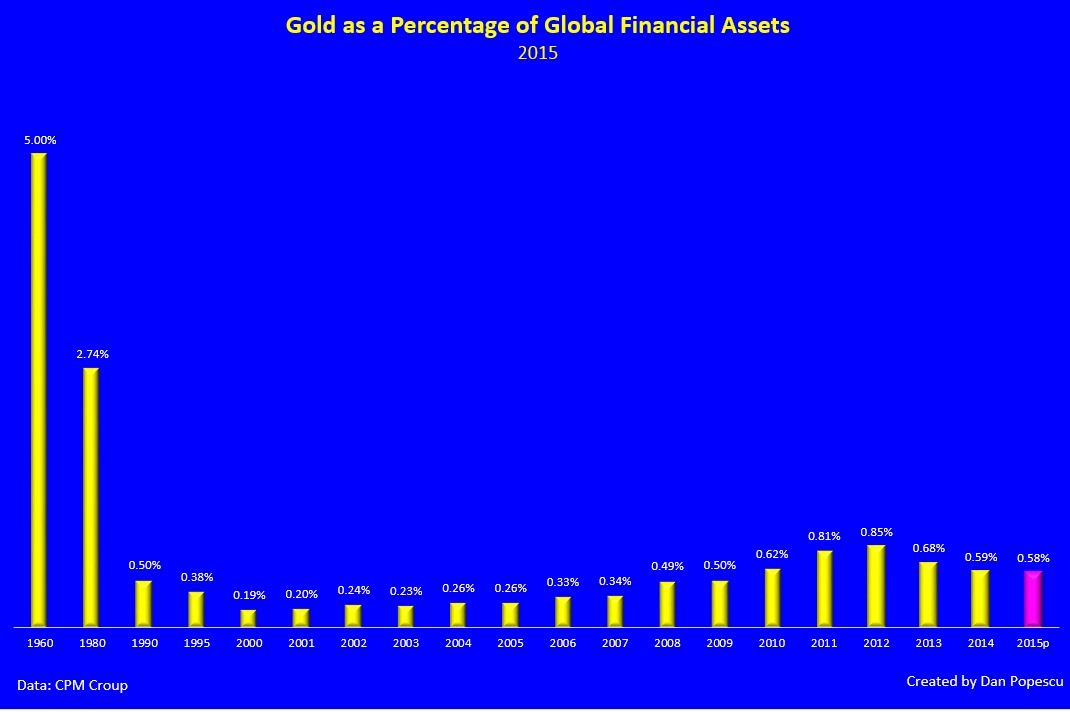
In the 80s and 90s when I was doing technical analysis research, I was often told by institutional portfolio managers not to tell anybody they were using technical analysis in their decision process. Computer screens with charts were turned off when someone came close. Technical analysis was considered unprofessional analysis (voo doo economics). Today every respectable and established investment management firm has a technical analyst. It seems to me to be the same today with gold. Accumulation is being done but very discreetly. It’s not good today for your career in the investment industry to mention gold and especially physical gold. An allocation of 5% will become part of a portfolio allocation as it was in the 60s. This, I promise you, will change sooner than you think.
Chart 10: Gold as a Percentage of global Financial Assets


Reblogged this on World Peace Forum.
LikeLike
Posted by daveyone1 | November 12, 2015, 6:59 pm